Wednesday, October 25, 2006

Monday, October 16, 2006

10.16 mapimation

So far I've got some interesting forms developing from the information i'm using to create my datascapes. The mapimation will consist of 2 primary surfaces that describe solar radiation both absorbed and irradiated. as an investigation of the surface potential, I have trim/split the two surfaces, creating many separate surfaces where the two intersected. I think that I am going to try to have the surfaces undulate between one another, then split up and condense themselves to the boundaries of the continents, showing the final relation of this condition at a global scale.
Another idea is to somehow escape the boundaries of the continents and morph into some abstract creation as the second image suggests. This would create a new spatial conditions and be much more interesting in my opinion as a mapimation, not just a tracing.

keyframe 1: Two datascapes intersecting one another


layers split up and set and varying levels


keyframe 2: imposing continents onto the surface


Wednesday, October 11, 2006

absorbed vs. reflected


These images show surface displacements according to the amount of radiation being absorbed and reflected onto the earth. The data produced in 3 dimensions has created an interesting topography which cuts through the atmosphere above the surface of the earth.

Click here to see the surfaces transform.


Red represents absorbtion/ yellow represents reflected


The map of the earth is rendered undernearth with a slight transparency to show scale and spatial relations

Monday, October 09, 2006

final animation in progress

animation in progress...

In this beginning stage, radiation from the sun is represented by red balls of energy that fall and collide with each other, collecting and dispersing energy as they make their way down to the surface. The idea is to find a way to best describe the dispertion of energy across the surface of the earth. Some resulting information I am looking for is the flux that is produced on the surface and the connections produced (whether they are visual peaks of energy or connecting areas of absorbtion). This animation is still in its beginning phases. The metaballs tool proved to be a valuable and effective visual aid used to describe the spread of energy I was looking for. I plan to map the irradiation of solar heat as well, and apply a negative weight, so that it has opposing effects on the positive absorbative metaballs, creating a clash of energy in the atmosphere as well.


original illustration


metaballs released


areas with highest concentrations

The sun's power causes many effects to our earth that we are becoming more commonly aware of, such as ozone depletion, that mappings such as these will help to evaluate such conditions for further development. I am interested the locations of holes in the ozone and how the solar energy impacts the surrounding areas, then comparing that information with previously gathered data. Sun spots and solar flares are more things we are affected by. Solar flares fluctuate annually and cause electronic disturbances in things like cell phones. I am interested in gathering information such as this along with the impact of solar energy, evaluating them individually and side-by-side for spatial formations and similarites in information, then possibly overlaying all the data to create a unique map or mapimation that will hopefully display new spatial conditions for design.


Friday, October 06, 2006

sample animation

this basic animation is to show the approach i'll be taking towards my mapimation. The larger sphere represents the sun releasing its energy, and the tiny balls that fall outward will combine and separate accordingly (using the morphing tool to do this) and fall to their designated locations on the globe. Since my topic is on radiance and solar energy, i plan to push that in my mapping with translucent layers, lights, glowing, etc... This exercise was made with path, morphing, and fly-through animations.

Mega Urbanism in China


Countries like China are evolving at such an incredible rate its breath-taking. The urban environment is constantly changing. City plans are developed in kilometers at a time, and skyscrapers are basically "stamped" onto the cities footprints because they've become so fundamental. "The Chinese city seems to develop into the direction of the `generic city’, “…nothing but a reflection of present need and present ability. [..] If it gets too small, it just expands. If it gets old, it just self-destructs and renews.”

China has made much progress in urban development in the past 25 years. They now have some of the tallest skyscrapers, biggest malls, fastest trains, and biggest dams in the world.

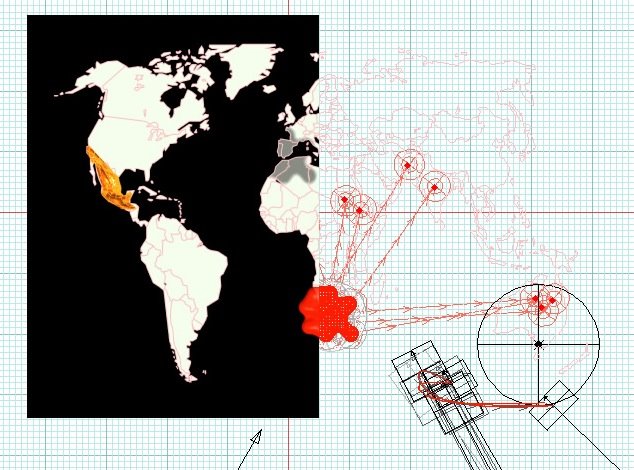
The Mekong River is one of the largest rivers in the world. This image shows the Mekong River along with 7 proposed hydropower dams represented by red dots. Four out of Seven have already been realized, with the other three still in their planning stages. The hydropower dams will continue to direct the development of habitation around the river, for example, further continuing China's spread outwards
the Mekong dams will benefit downstream countries, by storing water in the rainy season to reduce flooding and releasing it when needed in the dry season...” (6). According to David Jezeph, chief of Water and Mineral Resources at the Economic and Social Commission for Asia and the Pacific (ESCAP)

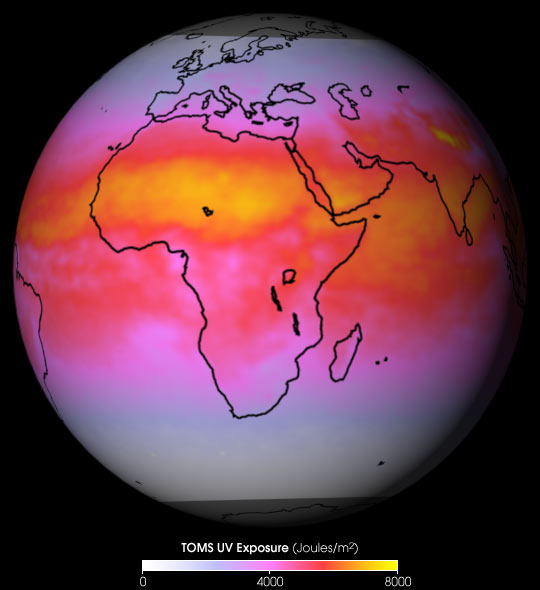
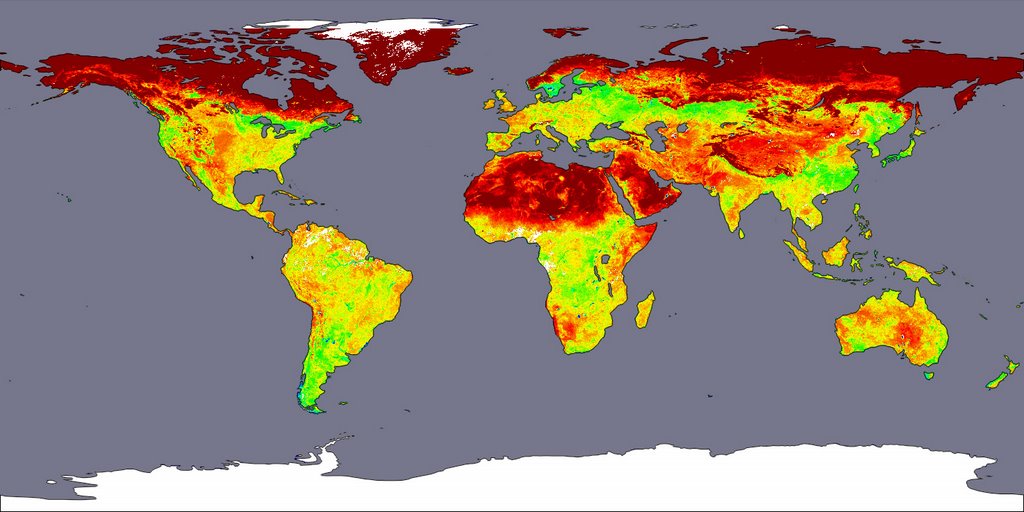
The rapid growth of cities like Beijing also reduce the quality of living. The worlds largest amount of nitrogen dioxide pollution has been recorded hanging over Beijing and Northeast China.


Some of these effects make me speculate the need for such an urban growth in cities such as this. How is the character of the city upheld and how is the culture still present. What kind of impact will the contiuous increase of hydropower dams in China have on the air quality? As the quote earlier suggests, are the development of such large city footprints making new cities more "general."

Monday, October 02, 2006

radiant energy

for my mapimations, i plan to continue my exploration in solar energy and focus on the absorbtion and irradiation of solar energy and its effects. I think some interesting maps might include not only the visible spectrum of the sunlight, but also ultraviolet and infrared rays as well. How can we interpret these invisible rays impacting the earth's surface and and develop and design in correlation to that data? There seems to be a sort of "belt of heat, or absorbsion across the surface of the earth where the equator is located. The image below shows both the absorption of heat (left) and the irradiance of heat (right) on the earth's surface.


altered image

This is an attempt at a mapping of various intensites of heat absorbed across the earth's surface.

original illustration