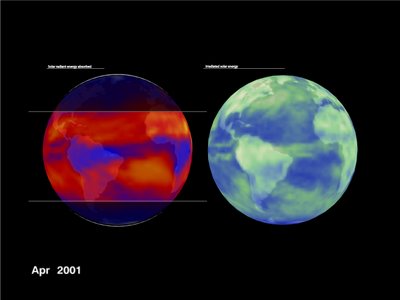
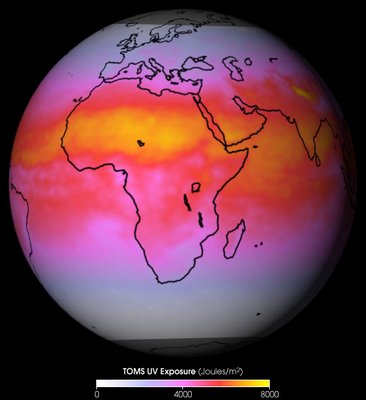
for my mapimations, i plan to continue my exploration in solar energy and focus on the absorbtion and irradiation of solar energy and its effects. I think some interesting maps might include not only the visible spectrum of the sunlight, but also ultraviolet and infrared rays as well. How can we interpret these invisible rays impacting the earth's surface and and develop and design in correlation to that data? There seems to be a sort of "belt of heat, or absorbsion across the surface of the earth where the equator is located. The image below shows both the absorption of heat (left) and the irradiance of heat (right) on the earth's surface.

altered image
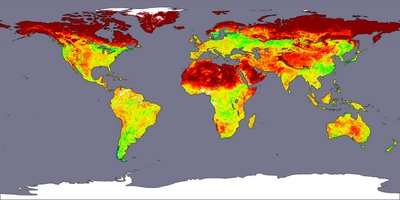
This is an attempt at a mapping of various intensites of heat absorbed across the earth's surface.

original illustration


1 comment:
nice maps, start modeling
Post a Comment