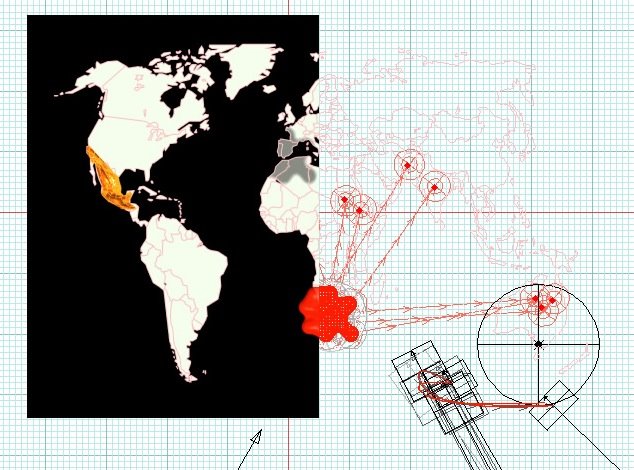
In this beginning stage, radiation from the sun is represented by red balls of energy that fall and collide with each other, collecting and dispersing energy as they make their way down to the surface. The idea is to find a way to best describe the dispertion of energy across the surface of the earth. Some resulting information I am looking for is the flux that is produced on the surface and the connections produced (whether they are visual peaks of energy or connecting areas of absorbtion). This animation is still in its beginning phases. The metaballs tool proved to be a valuable and effective visual aid used to describe the spread of energy I was looking for. I plan to map the irradiation of solar heat as well, and apply a negative weight, so that it has opposing effects on the positive absorbative metaballs, creating a clash of energy in the atmosphere as well.

original illustration

metaballs released

areas with highest concentrations
The sun's power causes many effects to our earth that we are becoming more commonly aware of, such as ozone depletion, that mappings such as these will help to evaluate such conditions for further development. I am interested the locations of holes in the ozone and how the solar energy impacts the surrounding areas, then comparing that information with previously gathered data. Sun spots and solar flares are more things we are affected by. Solar flares fluctuate annually and cause electronic disturbances in things like cell phones. I am interested in gathering information such as this along with the impact of solar energy, evaluating them individually and side-by-side for spatial formations and similarites in information, then possibly overlaying all the data to create a unique map or mapimation that will hopefully display new spatial conditions for design.


6 comments:
That second-to-last image gives me the best feel for what you're trying to describe.
i'm still a little unclear about what your final animation will show, but the images help with my confusion. can't wait to see where this goes, trevor!!
i think you have an interesting topic, and i really like some of the animation techniques that you are using. i think that you may want to consider the implications of the solar radiation...are there any compelling similarities between areas of high solar radiation beyond that fact that they receive more solar radiation.
It might produce an interesting map if you 2-dimensionally illustrate irradiated and absorbed energy, then put these maps on different levels and morph between the 2. it would create a speculative visualization of what happens in plan/elevation as radiation is reflected off of the earth's surface.
I think you have some great graphics, and your animation is also one of the clearest if seen. Reading your blog I became interested in the solar flares and the impact they have on the earth, it would be interesting to visually see these effects on the mapping as you have described them in your post
I agree with Melissa. Showing the sun's radiation affecting the surface of the ocean with those "bubbling" meshes would be very clear and effective.
Post a Comment